This is the March 2021 version of this page. For the September 2021 version that includes details about border openings, please go HERE.
Model Details
This page describes the details of the modelling that is presented on the COVID-19 Pandemic Trade-offs page.
We have pre-run 648 scenarios:
- through an agent-based model to estimate SARS-CoV-2 infection rates;
- then run each of these scenarios through an integrated epidemiological and economic model to estimate health loss (in health-adjusted life years or HALYs), health expenditure and GDP costs, with the proportion of times each scenario is optimal from either a health or partial-societal perspective. At the moment, this modelling also includes unintended health consequences of restrictions (including lockdowns) through road traffic injury, depression, anxiety, self-harm, and intimate partner violence. Coming soon, it will also include the effects of changes in physical activity.
The 648 scenarios are for combinations of vaccine coverage, vaccine efficacy at transmission (different from usually reported vaccine efficacy at stopping serious illness), policy response for restrictions (aggressive and moderate elimination, tight and loose suppression), and whether these restrictions are relaxed as vaccination coverage increase. (Coming soon will be extra scenarios for how international borders are opened; at the moment, this is included as a parameter behind the scenes that sees the daily expected incursions of SARS-CoV-2 cases increasing from 0.008 per day in Phase 1a to 0.512 per day in Phase 3 of the vaccination rollout, each with wide uncertainty. This, therefore, approximates a relaxing of borders as vaccination coverage increases. But in the future we will provide user options for border incursions.)
The modelling is specified for Victoria, Australia. But the modelling should apply to any state or Territory in Australia, or New Zealand.
Findings
The agent-based modelling presented at this site finds the following (in approximate order of importance):
- Things we do not have immediate control over:
- The reproductive rate (R0) for the circulating virus matters enormously. If a more infectious strain dominates (as is unfortunately likely) and gains a foothold in the community, social restrictions will be necessary in addition to vaccination to control outbreaks.
- Vaccine uptake and effectiveness of the vaccine at reducing transmission are—unsurprisingly—important.
- Things we can control:
- Pivoting to a loose suppression strategy, or relaxing the thresholds for when stage 3 or 4 lockdowns are applied, appears unwise until well into Phase 2 (vaccinating all adults) or Phase 3 (vaccinating children).
- Maximising vaccine coverage will assist dampening transmission. Even if herd immunity is not achieved (e.g. if R0 of circulating variants is high, and vaccine effectiveness at reducing transmission is non-ideal), maximizing vaccine uptake will mean social restrictions can be relaxed even if not removed.
As always, we are all still learning about SARS-CoV-2 and vaccines. We have made every effort to include up to date evidence in our modelling, and we will continue to improve it as new information arises.
Track Record
The most recent modelling presented on this site has not yet been peer-reviewed, but builds on a strong platform:
- Peer-reviewed Medical Journal of Australia paper on the probability of lock down achieving elimination using the ABM (Journal, PDF)
- Documentation of the ABM at Github (Link)
- Comments on the ABM at The Pursuit (Link)
- An overview of the proportional multistate lifetable model we use to estimate health and cost impacts (Journal, PDF)
- An analysis of the relative health and cost impacts of various policy response strategies in Victoria, pre-vaccination (aggressive and moderate elimination, tight and loose suppression) (Preprint, PDF, Under Review)
- A just completed analysis of the unintended health consequences of COVID-19 restrictions including lockdowns (Preprint, PDF, Under Review)
The remainder of this page describes some of the most important components of this modelling work.
Stages
A stage is a level of restrictions that can be imposed on society at any given time. There are five stages (1, 1b, 2, 3, 4) which correspond to the stages used in Victoria, Australia during 2020.
A representative sample of the restrictions associated with each stage are given in the following table.
| Stage 1 | Stage 1b | Stage 2 | Stage 3 | Stage 4 | |
|---|---|---|---|---|---|
| Reasons to leave home | Any | Any | Work or school; care or caregiving; daily exercise; buying essentials; visiting friends or family. | Work or school; care or caregiving; daily exercise; buying essentials. | Work or school; care or caregiving; daily exercise; buying essentials. |
| Limit on movement | None | None | None | 5km | 5km |
| Curfew | None | None | None | None | 8:00pm to 5:00am |
| Work from home | Return to work | If you can | If you can | If you can | Stay at home, unless a defined essential worker |
| Maximum number of home visitors each day | 100 | 20 | 5 | 0 | 0 |
| Maximum number at outdoor gatherings | 100 | 20 | 10 | 5 | 2 |
| Schools | Open | Open | Open | Closed (except to vulnerable children and children of permitted workers) | Closed (except to vulnerable children and children of permitted workers) |
| Maximum number in cafes and restaurants | 100 | 20 | 0 | 0 | 0 |
| Maximum number in places of worship | 100 | 22 | 12 | 0 | 0 |
| Masks | No | In public transport and indoor environment if not with household members | In public transport and indoor environment if not with household members | Mandatory out of home, unless doing vigorous physical activity | Mandatory out of home, unless doing vigorous physical activity |
The full details of the stages can be found in this PDF.
Strategies
A strategy is a set of rules for determining when to move between different stages. Our model considers four strategies: aggressive elimination, moderate elimination, tight suppression and loose suppression.
Mouse-over the following graphic to explore the rules associated with each strategy. (It works best on a desktop or laptop screen.)
Note that, in addition to the triggers presented on the above graphic, there is also a minimum time enforced between each easing or tightening of restrictions under each strategy. For full details, please see this document.
Strategy Relaxation
As more people become vaccinated, society may decide to tolerate higher levels of SARS-CoV-2 circulating in the community. If strategy relaxation is turned on, the thresholds for moving to higher stages of restrictions are increased with each phase of the vaccine rollout. Specifically, in the thresholds in Phase 2a are multiplied by a factor of 2, in Phase 2b by a factor of 4, and in Phase 3 by a factor of 8.
Vaccination Phases
The term phases refer to different time frames within the vaccine roll-out. The phases used in our model are lifted directly from the Australian national roll-out strategy, seen below.
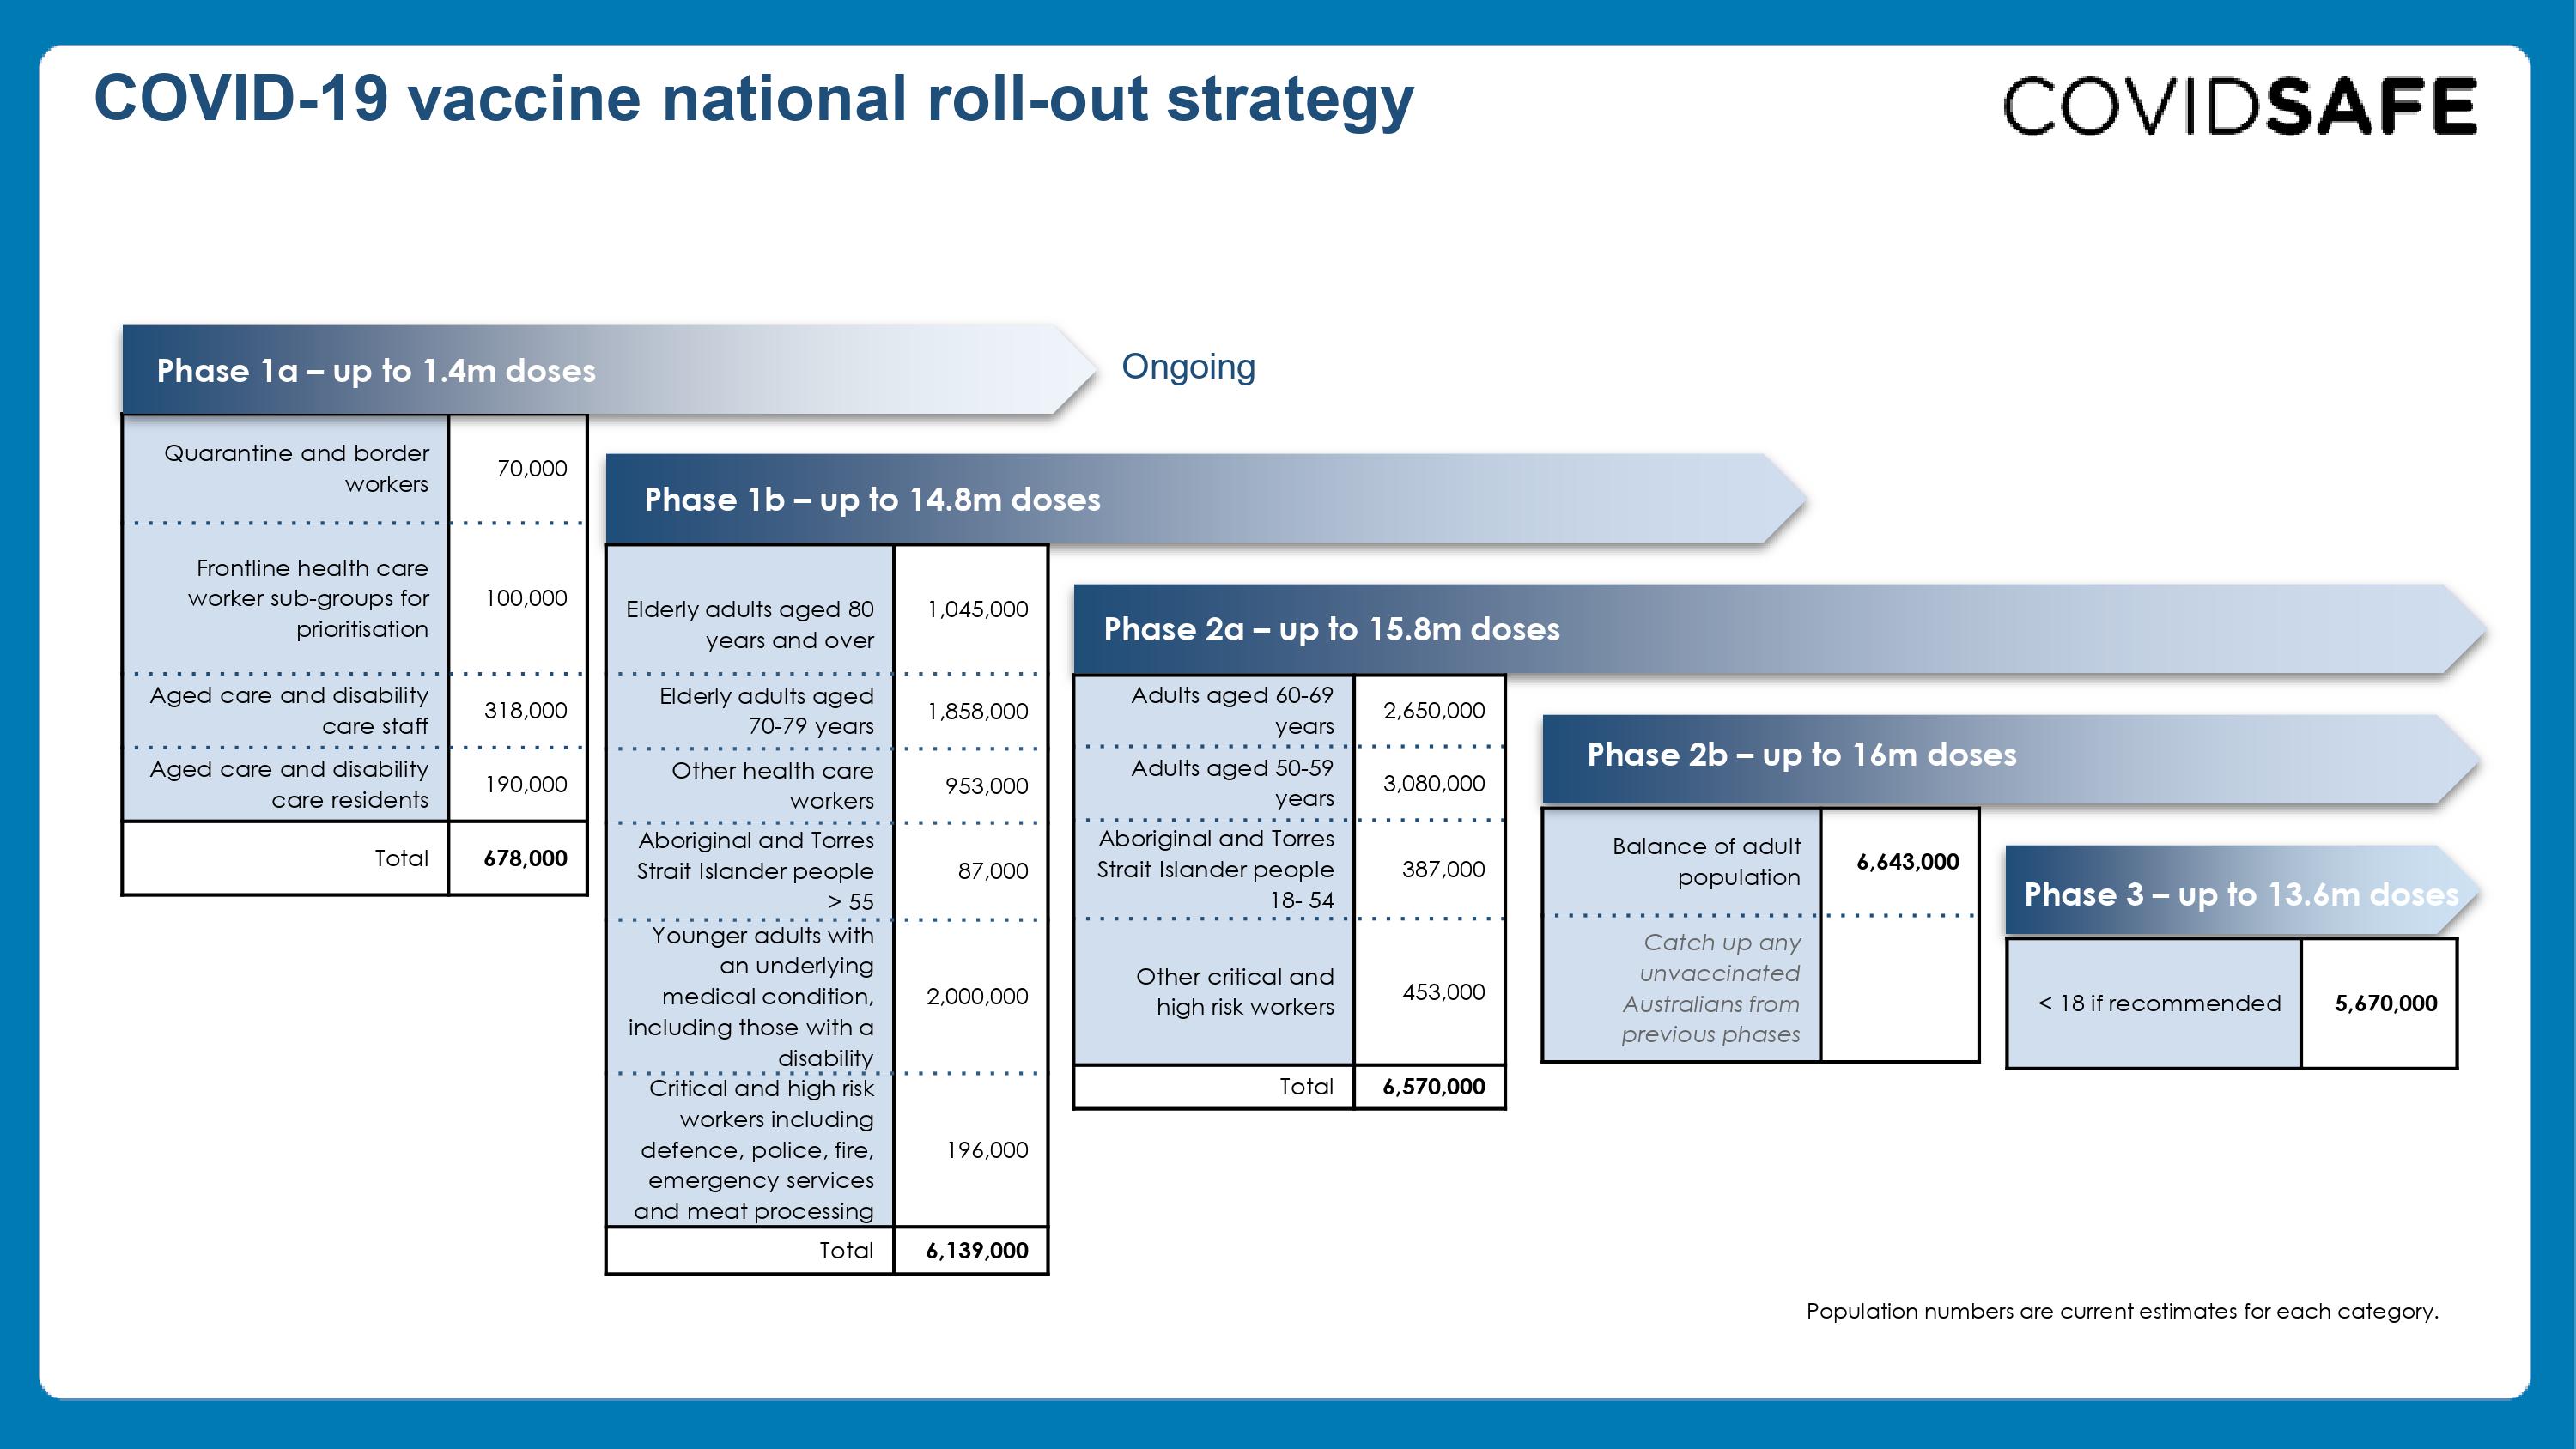
The table below gives the numbers of Australians by age, comorbidity, Indigeneity and occupation/setting, in each Phase of the vaccination rollout. We have used this timeline in our modelling, although as of late-March 2021, the Australian roll-out is behind this schedule.
| Phase | 1a | 1b | 2a | 2b | 3 |
|---|---|---|---|---|---|
| Phase start day | 0 | 10 | 91 | 182 | 273 |
| Quarantine and border control | 18746 | ||||
| Health, aged care, disability care | 158002 | ||||
| Other healthcare | 249054 | ||||
| Defence/fire/police/etc | 50882 | ||||
| Remaining people aged 70+ | 755196 | ||||
| Aboriginal/TSI 55-69 | 21424 | ||||
| Disabled/comorbidity 18-69 | 522210 | ||||
| Other critical workers | 117832 | ||||
| Aboriginal/TSI 18-54 | 101764 | ||||
| Remaining people aged 50-69 | 1491646 | ||||
| Remaining people aged 18-49 | 1729988 | ||||
| Remaining people aged 0-17 | 1478256 | ||||
| Percentage of population | 2.64% | 23.88% | 25.56% | 25.84% | 22.08% |
| Expected Incursions Per Day | 0.008 | 0.008 | 0.032 | 0.128 | 0.512 |
Vaccine Uptake
Everyone in a vaccination phase is offered a vaccine on one of the days of the phase. Each person either accepts or rejects the vaccine when offered, as determined by Vaccine Uptake parameter. This ensures a steady rate of vaccination throughout the phase, and that everyone who wants vaccination in each phase is vaccinated by the end of it.
The graph below shows the expected percentage of the population who are vaccinated at each point in the vaccine rollout, for three different possible vaccine acceptance rates.
Vaccine Lag time
The vaccine only takes effect three weeks after vaccination. We do not model the effect of (say) just one dose of vaccine, but assume the everyone who is vaccinated receives two doses.
Vaccine Effectiveness
Vaccine effectiveness at reducing TRANSMISSION is modelled through three mechanisms:
- The reduction in risk of a vaccinated person (compared to an unvaccinated person) being infected from an infected unvaccinated person.
- The reduction in duration of infectiousness of an infected vaccinated person (compared to an infected unvaccinated person).
- The reduction in peak infectivity of an infected vaccinated person (compared to an infected unvaccinated person).
Most research so far on reduction in transmission focuses only on mechanism a). But as vaccination coverage increases, mechanisms b) and c) will become increasingly important. In our agent-based model, we capture the effects of mechanisms b) and c) as a ‘triangle’.
For now, when the user selects (say) a 75% reduction in transmission, this is operationalized as a 37% reduction for each of the three mechanisms (i.e. 1 – (1-37%)^3 = 75%).
Note that this means that a relatively poor efficacy for mechanisms a) alone (i.e. a 37% reduction in risk for a vaccinated person getting infected from an infected unvaccinated person) can still lead to a reasonably good total reduction in transmissibility of 75% if the reduction in duration and peak infectivity are among vaccinated persons who get infected is also 37% each.
By extension, the seemingly optimistic reduction in total transmission of 90% is achieved by (only) a 54% reduction for each of mechanisms a), b) and c).
Reproduction Rate Calibration
For the ABM used in this tool, we have updated it from the ABM used in our previous modelling (e.g. for the Victorian RoadMap). Key updates include:
- altering the two dimensional distance the agents move in (to improve scaling of the model);
- improving how the super spreader function works;
- re-parametrisation of contact tracing; and
- the inclusion of vaccinations, as outlined above.
We therefore re-calibrated the model (by ‘tuning’ the global transmissibility parameter that—essentially—sets how infective each person is during a contact with another person. We first set this global transmissibility parameter to a level that achieved an \(R_0\) of 2.5, 3.125 and 3.75 for the three different scenarios of baseline infectiousness of SARS-CoV-2 (i.e. the wild type variant with \(R_0\) of 2.5, increasing to 3.75 for variants of concern). Then we ensured that for the \(R_0 = 2.5\) scenario that Stage 4 restrictions achieved the daily percentage reduction in infections observed in Victoria coming out of its second wave (with stage 4 restrictions) of 7 to 8% per day. Next, we ensured that in the \(R_0\) of 2.5 scenario, Stage 3 achieved an effective reproductive rate of less than 1.0 and Stage 2 of greater than 1.0 – each approximately equi-distant below and above an effective reproductive rate of 1.0.
Below is a graph of the effective reproductive rate by Stage of restrictions, in the absence of vaccination, for the three \(R_0\) scenarios of 2.5, 3.125 and 3.75.
Assumptions and Limitations
Agent-based model
Simulating the impact of COVID-19 policy responses is challenging. Our ABM has been extensively investigated by ourselves and others for errors, conceptual rigour, parameterization and such like – and therefore we believe has face validity. It has also successfully predicted that elimination is achievable, and predicted well the exit of Victoria from its second wave, i.e. to the extent possible, it is calibrated.
However, our ABM is ‘just’ a simplified representation of reality, and will not be perfect. It is designed to represent multiple scenarios, including varying stages of social restrictions and vaccination coverage and vaccine efficacy.
Regarding vaccine efficacy, the efficacy that matters most for the ABM is the reduction in transmissibility. Data is incomplete on this. We modelled it as three parameters: X = percentage reduction in chance of vaccinated person being infected from unvaccinated infected person; Y = percentage reduction in duration of infection for vaccinated person who becomes infected; and Z = percentage reduction in infectivity for vaccinated person who becomes infected. The transmissibility parameter you select as a user is the combination of all three, and conceptually is the reduction of transmissibility of SARS-CoV-2 between two vaccinated people (one infected, one susceptible), compared to transmissibility between two non-vaccinated people. Given your selection of this transmissibility variable (say you pick 75% reduction), the model calculates X, Y and Z for you (assumed the same, namely 1 – (1-75%)^(1/3) = 37%). The exact values of X, Y and Z for each vaccine for each SARS-CoV-2 variant are not yet known. However, based on evidence so far, 37% (and therefore a reduction in transmissibility of 75%) seems conservative – it may be higher still.
Other important aspects of the model include the contact tracing function, compliance with quarantine, changes in behaviour of non-essential workers, and many other parameters that you can read more about elsewhere.
Should you have any concerns about our model assumptions and specifications, we would welcome your suggestions for improvements or alternative specifications. For the latter, if simple to run, we will attempt to do them for you – please email population-interventions@unimelb.edu.au.
Contributors
- The data visualisations and interface for this tool were developed by Luke Thorburn.
- The modelling was led by Dr Tim Wilson, assisted by Haifeng Zhao and Sachith Seneviratne. The original agent-based model was built by Dr Jason Thompson, assisted by Profs Rod McClure, Mark Stevenson and Tony Blakely. The integrated epidemiological and economic model (proportional multistate lifetable) is a collaboration between the University of Melbourne and the Institute of Health Metrics and Evaluation (University of Washington), with key contributions from: Prof Abie Flaxman and Mr James Collins (IHME); Drs Rob Moss, Nic Geard, Patrick Andersen and Tim Wilson (University of Melbourne), assisted by all members of the Population Interventions Unit (Drs Driss Ait Ouakrim and Laxman Bablani, and Profs Vijaya Sundararajan and Tony Blakely).
- The determination of which diseases and conditions are impacted by COVID-19 restrictions, and with what magnitude, was undertaken by Dr Driss Ait Ouakrim, Ms Ameera Katar, Mr Patrick Abraham, Dr Natalie Carvalho and Prof Nathan Grills.
- Overall leadership of the body of work was by Prof Tony Blakely.
- Web hosting and technical support was provided by Grace Dong and Dr Melissa Makin.
- We acknowledge a generous anonymous philanthropic grant, through Advancement, that enabled this project.
Contact Details
Please direct media or other enquiries about this research to the Population Interventions Unit at the following address.